Short Answer
SCENARIO 17-8
The superintendent of a school district wanted to predict the percentage of students passing a sixth-
grade proficiency test. She obtained the data on percentage of students passing the proficiency test
(% Passing), daily mean of the percentage of students attending class (% Attendance), mean teacher
salary in dollars (Salaries), and instructional spending per pupil in dollars (Spending) of 47 schools in
the state. Following is the multiple regression output with Passing as the dependent variable, Attendance, Salaries and Spending:
ANOVA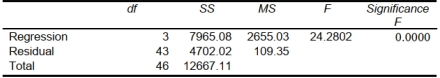
-Referring to Scenario 17-8, what is the p-value of the test statistic to determine whether there is
a significant relationship between percentage of students passing the proficiency test and the
entire set of explanatory variables?
Correct Answer:

Verified
2.3853E−09...View Answer
Unlock this answer now
Get Access to more Verified Answers free of charge
Correct Answer:
Verified
View Answer
Unlock this answer now
Get Access to more Verified Answers free of charge
Q66: Classification tree is not sensitive to the
Q73: SCENARIO 17-12<br>The marketing manager for a nationally
Q74: SCENARIO 17-5<br>You worked as an intern
Q75: SCENARIO 17-13<br>The table below contains the sparklines
Q76: SCENARIO 17-13<br>The table below contains the sparklines
Q78: SCENARIO 17-9<br>What are the factors that determine
Q79: SCENARIO 17-3 A financial analyst wanted
Q80: SCENARIO 17-11<br>A logistic regression model was estimated
Q81: SCENARIO 17-14<br>The treemap below shows the amounts
Q82: SCENARIO 17-10 Given below are results