Short Answer
SCENARIO 17-15
The tree diagram below shows the results of the classification tree model that has been constructed to
predict the probability of a cable company's customers who will switch ("Yes" or "No") into its
bundled program offering based on the price ($30, $40, $50, $60) and whether the customer spends
more than 5 hours a day watching TV ("Yes" or "No") using the data set of 100 customers collected
from a survey. 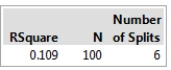
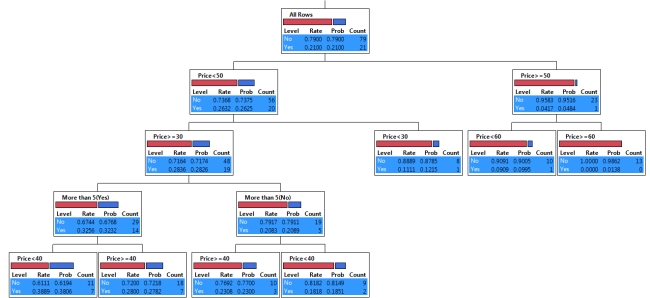
-Referring to Scenario 17-15, the first split occurs at what price?
Correct Answer:

Verified
Correct Answer:
Verified
Q25: The probability that a particular brand of
Q27: SCENARIO 17-9<br>What are the factors that determine
Q28: SCENARIO 17-10 Given below are results
Q29: SCENARIO 17-10 Given below are results
Q31: SCENARIO 17-10 Given below are results
Q32: SCENARIO 17-9<br>What are the factors that determine
Q33: SCENARIO 17-10 Given below are results
Q34: SCENARIO 17-1<br>A real estate builder wishes
Q35: SCENARIO 17-8<br>The superintendent of a school
Q38: Some business analytics involve starting with many