True/False
SCENARIO 14-15
The superintendent of a school district wanted to predict the percentage of students passing a sixth-
grade proficiency test. She obtained the data on percentage of students passing the proficiency test
(% Passing), mean teacher salary in thousands of dollars (Salaries), and instructional spending per
pupil in thousands of dollars (Spending) of 47 schools in the state. Following is the multiple regression output with Passing as the dependent variable,
Salaries and Spending:
ANOVA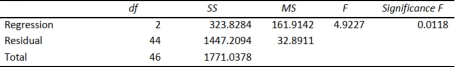
-Referring to Scenario 14-15, the null hypothesis should be rejected at a 5% level
of significance when testing whether instructional spending per pupil has any effect on
percentage of students passing the proficiency test, taking into account the effect of mean teacher
salary.
Correct Answer:

Verified
Correct Answer:
Verified
Q1: 14-22 Introduction to Multiple Regression One
Q2: SCENARIO 14-15<br>The superintendent of a school
Q5: 14-30 Introduction to Multiple Regression <img
Q7: The coefficient of multiple determination
Q8: SCENARIO 14-3<br>An economist is interested to
Q9: SCENARIO 14-20-A<br>You are the CEO of
Q47: SCENARIO 14-17<br>Given below are results from the
Q65: SCENARIO 14-17<br>Given below are results from the
Q72: SCENARIO 14-8<br>A financial analyst wanted to examine
Q172: If you have taken into account all