True/False
SCENARIO 14-15
The superintendent of a school district wanted to predict the percentage of students passing a sixth-
grade proficiency test. She obtained the data on percentage of students passing the proficiency test
(% Passing), mean teacher salary in thousands of dollars (Salaries), and instructional spending per
pupil in thousands of dollars (Spending) of 47 schools in the state. Following is the multiple regression output with Passing as the dependent variable,
Salaries and Spending:
ANOVA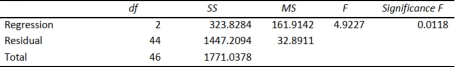
-Referring to Scenario 14-15, you can conclude definitively that mean teacher
salary individually has no impact on the mean percentage of students passing the proficiency test,
taking into account the effect of instructional spending per pupil, at a 1% level of significance
based solely on but not actually computing the 99% confidence interval estimate for ?1.
Correct Answer:

Verified
Correct Answer:
Verified
Q10: SCENARIO 14-8<br>A financial analyst wanted to examine
Q98: SCENARIO 14-6 One of the most common
Q136: SCENARIO 14-19 The marketing manager for a
Q175: SCENARIO 14-4<br>A real estate builder wishes to
Q197: SCENARIO 14-8<br>A financial analyst wanted to examine
Q202: If a categorical independent variable contains 2
Q220: A regression had the following results: SST
Q230: SCENARIO 14-15<br>The superintendent of a school district
Q263: SCENARIO 14-20-B<br>You are the CEO of
Q265: 14-30 Introduction to Multiple Regression <img