Multiple Choice
SCENARIO 14-20-A
You are the CEO of a dairy company. You are planning to expand milk production by purchasing
additional cows, lands and hiring more workers. From the existing 50 farms owned by the company,
you have collected data on total milk production (in liters) , the number of milking cows, land size (in
acres) and the number of laborers. The data are shown below and also available in the Excel file
Scenario14-20-DataA.XLSX.
S 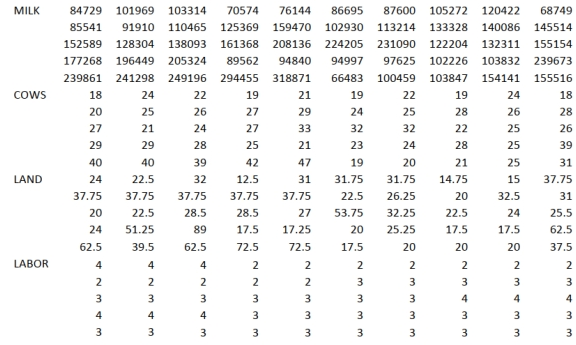
You believe that the number of milking cows , land size and the number of laborers are the best predictors for total milk production on any given farm.
-Referring to Scenario 14-20-A, which of the following is a correct interpretation for the r- square?
A) 90.15% of the total variation in total milk production can be explained by the number of milking cows, the land size and the number of laborers.
B) 90.15% of the total variation in total milk production can be explained by the number of milking cows, the land size and the number of laborers after adjusting for the level of
Significance
C) 90.15% of the total variation in total milk production can be explained by the number of milking cows, the land size and the number of laborers holding constant the effect of all
The independent variables.
D) 90.15% of the total variation in total milk production can be explained by the number of milking cows, the land size and the number of laborers after adjusting for the number of
Predictors and sample size.
Correct Answer:

Verified
Correct Answer:
Verified
Q33: SCENARIO 14-4<br>A real estate builder wishes to
Q35: When an explanatory variable is dropped from
Q115: SCENARIO 14-16 What are the factors that
Q169: When a dummy variable is included in
Q203: SCENARIO 14-20-A<br>You are the CEO of
Q204: SCENARIO 14-10<br>You worked as an intern
Q206: SCENARIO 14-20-A<br>You are the CEO of
Q209: SCENARIO 14-8 A financial analyst wanted
Q210: SCENARIO 14-20-B<br>You are the CEO of
Q211: SCENARIO 14-20-A<br>You are the CEO of