True/False
Given below is the scatter plot of the price/earnings ratio versus earnings per
share of 20 U.S. companies. There appears to be a negative relationship between price/earnings
ratio and earnings per share. 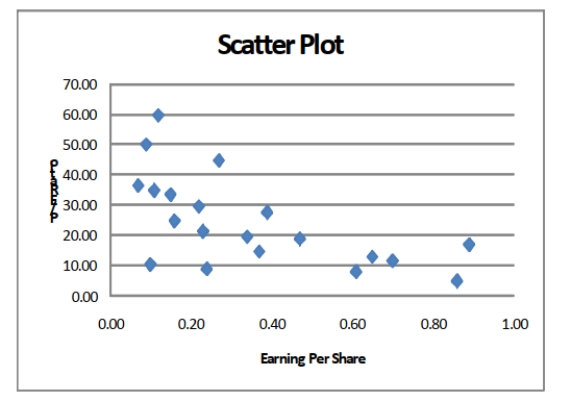
Correct Answer:

Verified
Correct Answer:
Verified
Q11: SCENARIO 2-6<br>A sample of 200 students at
Q18: SCENARIO 2-10<br>The histogram below represents scores achieved
Q36: SCENARIO 2-14 <br>The table below contains the
Q38: SCENARIO 2-14 <br>The table below contains the
Q161: SCENARIO 2-14 <br>The table below contains the
Q167: SCENARIO 2-12<br>The table below contains the opinions
Q179: SCENARIO 2-7<br>The Stem-and-Leaf display below contains data
Q183: SCENARIO 2-9<br>The frequency distribution below represents the
Q248: SCENARIO 2-20-B<br>A recent consumer survey on
Q256: SCENARIO 2-19-B<br>You are the quality control