True/False
Given below is the scatter plot of the market value (thousands$) and profit
(thousands$) of 50 U.S. companies. Higher market values appear to be associated with higher
profits. 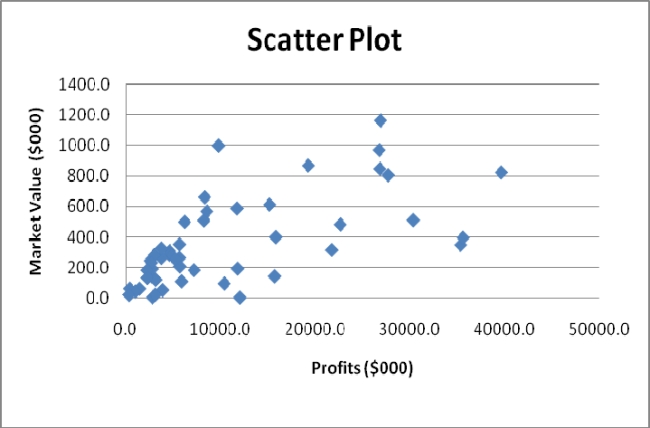
Correct Answer:

Verified
Correct Answer:
Verified
Related Questions
Q33: In general,a frequency distribution should have at
Q36: SCENARIO 2-19-A<br>You are the quality control
Q40: SCENARIO 2-14 <br>The table below contains the
Q43: You have collected data on the responses
Q66: SCENARIO 2-1<br>An insurance company evaluates many numerical
Q70: You have collected data on the monthly
Q100: SCENARIO 2-14 <br>The table below contains the
Q104: When constructing charts,the following is plotted at
Q134: SCENARIO 2-18<br>The stem-and-leaf display below shows the
Q138: The percentage distribution cannot be constructed from