True/False
Given below is the scatter plot of the market value (thousands$) and profit
(thousands$) of 50 U.S. companies. There appears to be a negative relationship between market
value and profit. 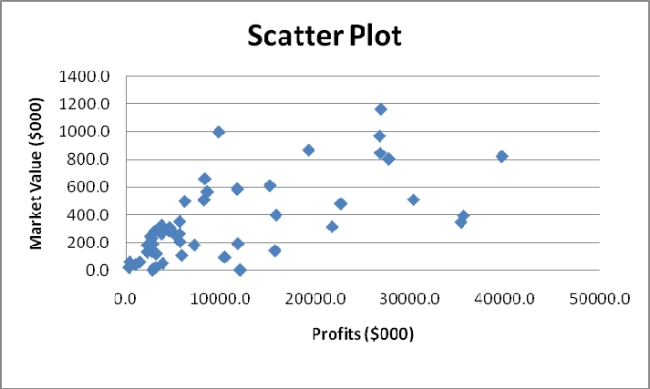
Correct Answer:

Verified
Correct Answer:
Verified
Q48: SCENARIO 2-7<br>The Stem-and-Leaf display below contains data
Q52: The Guidelines for Developing Visualizations recommend always
Q54: SCENARIO 2-2<br>2-2 Organizing and Visualizing Variables<br>At a
Q60: The original data values cannot be determined
Q97: SCENARIO 2-8<br>The Stem-and-Leaf display represents the number
Q120: SCENARIO 2-8<br>The Stem-and-Leaf display represents the number
Q175: To evaluate two categorical variables at the
Q184: SCENARIO 2-9<br>The frequency distribution below represents the
Q207: SCENARIO 2-12 The table below contains the
Q207: SCENARIO 2-19-A<br>You are the quality control