True/False
Given below is the scatter plot of the number of employees and the total revenue
($millions) of 20 U.S. companies. Companies that have higher numbers of employees appear to
also have higher total revenue. 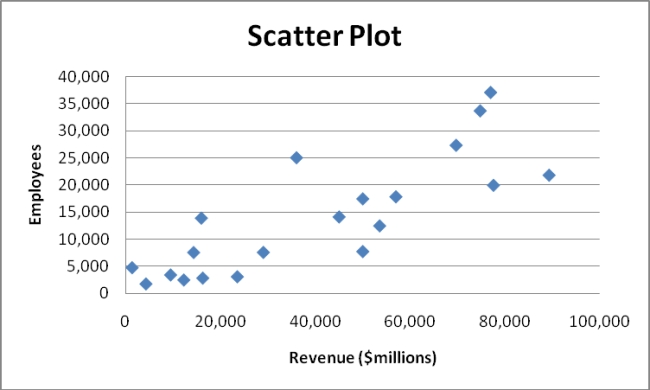
Correct Answer:

Verified
Correct Answer:
Verified
Related Questions
Q39: A multidimensional contingency table allows you to
Q48: SCENARIO 2-12<br>The table below contains the opinions
Q81: SCENARIO 2-16 The figure below is the
Q124: Apple Computer,Inc.collected information on the age of
Q129: The width of each class grouping or
Q141: Data on 1,500 students' height were collected
Q162: One of the advantages of a pie
Q176: SCENARIO 2-8<br>The Stem-and-Leaf display represents the number
Q196: SCENARIO 2-20-B<br>A recent consumer survey on
Q213: SCENARIO 2-12 The table below contains the