Essay
A fast food chain test marketing a new sandwich chose 18 of its stores in one major metropolitan area. Nine of the stores were in malls and nine were free standing. The sandwich was offered at three different introductory prices. The table shows the number of new sandwiches sold at each location for each location type and price combination. 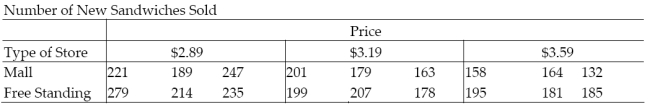 a. Write a model for the mean number of sandwiches sold, E(y), assuming that the relationship between E(y) and price, x1, is first-order. b. Fit the model to the data. c. Write the prediction equations for mall and free-standing stores. d. Do the data provide sufficient evidence that the change in number of sandwiches sold with respect to price is different for mall and free-standing stores? Use α = .01. 12.9 Comparing Nested Models (Optional) 1 Conduct Test to Compare Complete and Reduced Models
Correct Answer:

Verified
Correct Answer:
Verified
Q26: The method of fitting first-order models is
Q117: The sum of squared errors (SSE)of a
Q118: The model <span class="ql-formula" data-value="E
Q120: The model <span class="ql-formula" data-value="E
Q121: In the quadratic model <span
Q123: In the presence of multicollinearity, the
Q124: A study of the top MBA
Q125: It is desired to build a
Q126: In any production process in which
Q127: The printout shows the results of