Multiple Choice
Data has been collected and a normal probability plot for one of the variables is shown below. Based on your knowledge of normal probability plots, do you believe the variable in question is normally distributed? The data are represented by the"o" symbols in the plot. 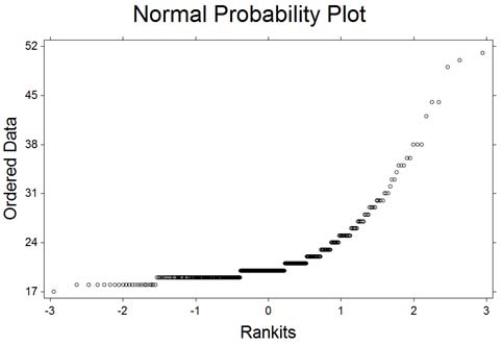
A) Yes. The plot reveals a straight line and this indicates the variable is normally distributed.
B) No. The plot does not reveal a straight line and this indicates the variable is not normally distributed.
C) Yes. The plot reveals a curve and this indicates the variable is normally distributed.
Correct Answer:

Verified
Correct Answer:
Verified
Q17: P(-1 < x < 0) = P(0
Q18: A certain baseball player hits a home
Q19: For a standard normal random variable, find
Q20: Suppose x is a random variable best
Q21: The amount of soda a dispensing machine
Q23: Suppose a uniform random variable can be
Q25: The time between arrivals at an ATM
Q26: A machine is set to pump cleanser
Q81: The time between equipment failures (in days)at
Q109: Find a value of the standard normal