Multiple Choice
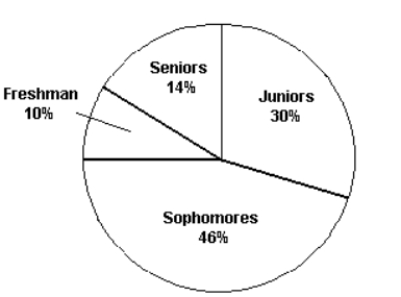 The pie chart shows the classifications of students in a statistics class. What percentage of the class consists of freshman, sophomores, and juniors?
A) 86%
B) 14%
C) 44%
D) 54%
Correct Answer:

Verified
Correct Answer:
Verified
Related Questions
Q158: A study was designed to investigate the
Q159: A survey was conducted to determine
Q160: An annual survey sent to retail
Q161: Complete the frequency table for the
Q162: The calculator screens summarize a data set.
Q165: In a summary of recent real estate
Q165: A recent survey was conducted to compare
Q166: <img src="https://d2lvgg3v3hfg70.cloudfront.net/TB4890/.jpg" alt=" The
Q167: The calculator screens summarize a data set.
Q168: On a given day, the price of