Multiple Choice
A dot plot of the speeds of a sample of 50 cars passing a policeman with a radar gun is shown below. 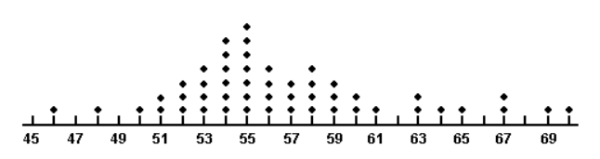 What proportion of the motorists were driving above the posted speed limit of 60 miles per hour?
A) 0.18
B) 0.22
C) 0.04
D) 2
Correct Answer:

Verified
Correct Answer:
Verified
Related Questions
Q76: The amount spent on textbooks for the
Q78: A sample of professional golfers was taken
Q81: Parking at a university has become a
Q83: Given a data set, which of the
Q84: The scores for a statistics test
Q85: At the U.S. Open Tennis Championship a
Q100: Which measures variability about the mean, the
Q102: The mean of a data set is
Q126: The outer fences of a box plot
Q153: If 25% of your statistics class is