Essay
The calculator screens summarize a data set. 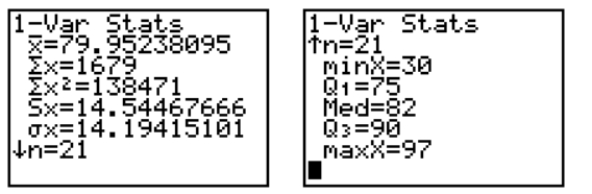 a. Identify the lower and upper quartiles of the data set. b. Find the interquartile range. c. Is there reason to suspect that the data may contain an outlier? Explain.
Correct Answer:

Verified
a. lower quartile: Q1=75; upper quartile...View Answer
Unlock this answer now
Get Access to more Verified Answers free of charge
Correct Answer:
Verified
View Answer
Unlock this answer now
Get Access to more Verified Answers free of charge
Q39: In practice, the population mean µ
Q50: The output below displays the mean
Q51: A study was designed to investigate the
Q52: The following data represent the scores
Q53: A data set contains the observations
Q56: A sociologist recently conducted a survey
Q58: Each year advertisers spend billions of
Q59: A study was designed to investigate the
Q62: A histogram can be constructed using either
Q109: The z-score uses the quartiles to identify