Multiple Choice
The box plot shown below was constructed for the amount of soda that was poured by a filling machine into 12-ounce soda cans at a local soda bottling company. 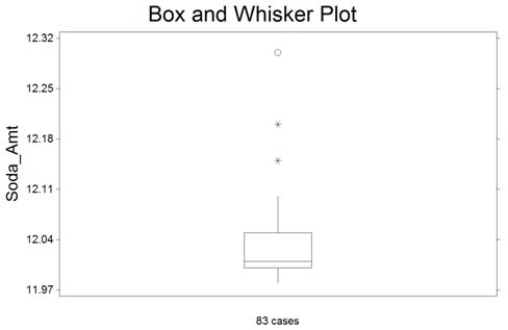 We see that one soda can received 12.30 ounces of soda on the plot above. Based on the box plot presented, how would you classify this observation?
A) expected observation
B) suspect outlier
C) highly suspect outlier
D) it has a lot of soda
Correct Answer:

Verified
Correct Answer:
Verified
Q30: At the U.S. Open Tennis Championship a
Q32: The data show the total number
Q33: At the U.S. Open Tennis Championship a
Q35: Explain how it can be misleading to
Q36: At the U.S. Open Tennis Championship a
Q37: At the U.S. Open Tennis Championship a
Q38: A study was designed to investigate the
Q53: In skewed distributions, the mean is the
Q66: A retail storeʹs customer satisfaction rating is
Q145: A larger standard deviation means greater variability