True/False
The scatterplot below shows a negative relationship between two variables. 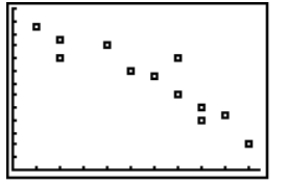
Correct Answer:

Verified
Correct Answer:
Verified
Related Questions
Q9: The slices of a pie chart must
Q110: Many firms use on-the-job training to teach
Q111: Which of the following is not a
Q112: Fill in the blank. _ gives us
Q114: Calculate the variance of a sample
Q116: A sociologist recently conducted a survey
Q118: The amount spent on textbooks for the
Q119: The table shows the number of
Q120: The mean <span class="ql-formula" data-value="\bar
Q168: Box plots are used to detect outliers