Multiple Choice
The following graph shows the populations of the metropolitan areas of City X and City Y over six years. 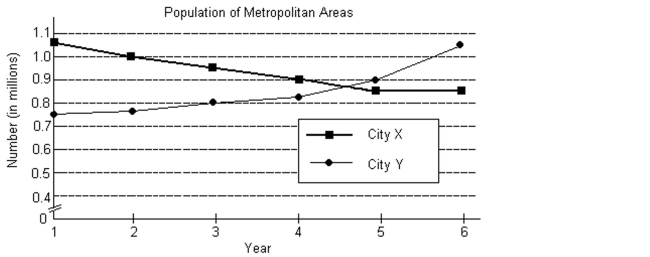
-In what years was the population of the City X metropolitan area less than that of the City Y metropolitan area?
A) Years 5-6
B) Years
C) Years 3-5
D) Years
Correct Answer:

Verified
Correct Answer:
Verified
Q21: Find the inverse, if it exists,
Q22: Find the value of the determinant.<br>-
Q23: Graph the solution set of the
Q24: Provide an appropriate response.<br>-Which one of
Q25: Use Cramer's rule to solve the
Q27: Find the indicated matrix.<br>-Let <span
Q28: Give all solutions of the nonlinear
Q29: Evaluate the determinant.<br><img src="https://d2lvgg3v3hfg70.cloudfront.net/TB7516/.jpg" alt="Evaluate the determinant.
Q30: Use Cramer's rule to solve the
Q31: Determine the inequality which matches the