Multiple Choice
The following graph shows the populations of the metropolitan areas of City X and City Y over six years. 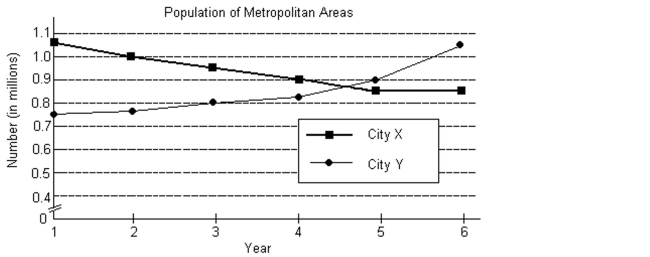
-At the time when the populations of the two metropolitan areas were equal, what was the approximate population of each area?
A) about 0.95 million
B) about 0.92 million
C) about 0.87 million
D) about 1.03 million
Correct Answer:

Verified
Correct Answer:
Verified
Q342: Find the values of the variables
Q343: Determine the inequality which matches the
Q344: Find the partial fraction decomposition for
Q345: Solve the equation for x.<br> <span
Q346: Solve the linear programming problem.<br>-The Acme Class
Q348: Find the partial fraction decomposition for
Q349: For any augmented matrix of a system
Q350: Solve the linear programming problem.<br>-An automotive glass
Q351: Find the partial fraction decomposition for
Q352: Graph the solution set of the