Multiple Choice
The following graph shows the populations of the metropolitan areas of City X and City Y over six years. 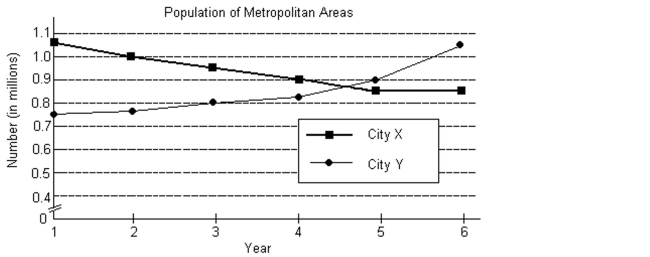
-If equations of the form y f(t) were determined that modeled either of the two graphs, then the variable t would represent _______ and the variable y would represent _______.
A) City Y; City X
B) City X; City Y
C) population (in millions) ; year
D) year; population (in millions)
Correct Answer:

Verified
Correct Answer:
Verified
Q360: Provide an appropriate response.<br>-Fill in the blank
Q361: A company makes 3 types of cable.
Q362: Choose the one alternative that best
Q363: Use a graphing calculator to Express
Q364: A chair manufacturing company has two
Q366: Use a graphing calculator and the
Q367: Provide an appropriate response.<br>-What is the
Q368: Write the word or phrase that
Q369: Suppose that you are solving a
Q370: Solve the problem using matrices.<br>-A chemist