Multiple Choice
The graph shows the region of feasible solutions. Find the maximum or minimum value, as specified, of the objective
function.
-objective function ; minimum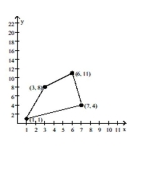
A)
B)
C)
D)
Correct Answer:

Verified
Correct Answer:
Verified
Related Questions
Q423: For the equation, determine the constants
Q424: Use the Gauss-Jordan method to solve
Q425: Find the partial fraction decomposition for
Q426: Determine the system of inequalities illustrated
Q427: If the graphs of a system of
Q429: Solve the system.<br> <span class="ql-formula" data-value="\begin{array}
Q430: Find the partial fraction decomposition for
Q431: A nonlinear system is given, along
Q432: Graph the solution set of the
Q433: Decide whether or not the matrices