Multiple Choice
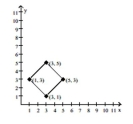
The graph shows the region of feasible solutions. Find the maximum or minimum value, as specified, of the objective
function.
- 
A) 13
B) 27
C) 100
D) 29
Correct Answer:

Verified
Correct Answer:
Verified
Related Questions
Q219: Choose the one alternative that best
Q220: The graph shows the region of
Q221: Solve the system by using the
Q222: Solve the problem using matrices.<br>-John has a
Q223: Graph the inequality.<br>- <span class="ql-formula" data-value="-3
Q225: Find the values of the variables
Q226: Write the augmented matrix for the
Q227: Find the value of the determinant.<br>-
Q228: Find the equation of the parabola
Q229: Use Cramer's rule to solve the