Multiple Choice
The student population of a small school has been increasing as shown in the following table. 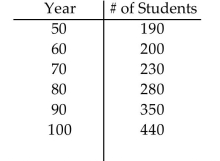
Determine the linear, quadratic, or cubic function that best fits the data.
A)
B)
C)
D)
Correct Answer:

Verified
Correct Answer:
Verified
Related Questions
Q317: Match the equation to the correct
Q318: Sketch the graph of the parabola.<br>-<img src="https://d2lvgg3v3hfg70.cloudfront.net/TB7516/.jpg"
Q319: Translate the given formula to an
Q320: Use synthetic division to perform the
Q321: Use the equation and the corresponding
Q323: Solve the problem. Round your answer to
Q324: Use the remainder theorem and synthetic
Q325: Sketch the graph of the rational
Q326: Identify any vertical, horizontal, or oblique
Q327: Identify the vertex of the parabola.<br>-Identify