Multiple Choice
The line graph shows the recorded hourly temperatures in degrees Fahrenheit at an airport. 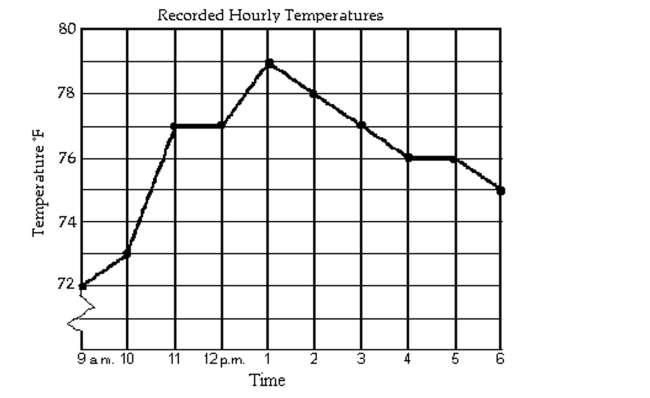
-At what time was the temperature the highest?
A) 2 p.m.
B) 5 p.m.
C) 11 a.m.
D) 1 p.m.
Correct Answer:

Verified
Correct Answer:
Verified
Related Questions
Q397: Determine whether the three points are
Q398: Describe how the graph of the
Q399: Find the average rate of change
Q400: Write all linear equations in slope-intercept
Q401: Describe how the graph of the
Q403: Graph the line described.<br>-through <span
Q404: Give the domain and range of
Q405: Describe how the graph of the
Q406: Give the domain and range of
Q407: Give the domain and range of