Multiple Choice
The line graph shows the recorded hourly temperatures in degrees Fahrenheit at an airport. 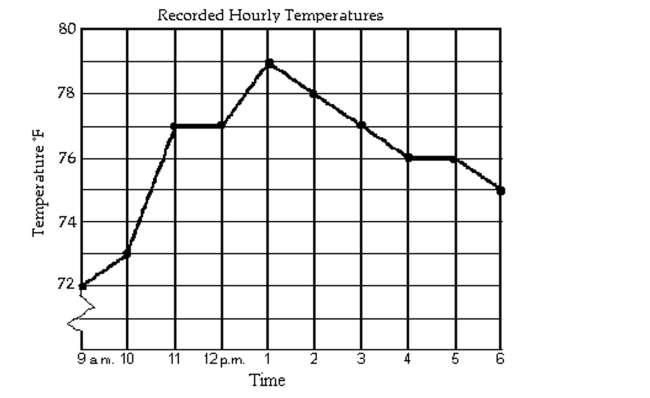
-At what time was the temperature its lowest?
A) 4 p.m.
B) 9 a.m.
C) 1 p.m.
D) 6 p.m.
Correct Answer:

Verified
Correct Answer:
Verified
Related Questions
Q107: Give the domain and range of
Q108: Find the requested value.<br>- <span class="ql-formula"
Q109: Use the graph to solve the
Q110: Decide whether the relation defines a function.<br>-<img
Q111: Write an equation for the line
Q113: Determine whether the three points are
Q114: Provide an appropriate response.<br>-What is the
Q115: Match the equation with the correct
Q116: Use the graphs to find the value
Q117: Determine whether <span class="ql-formula" data-value="(