Multiple Choice
The line graph shows the recorded hourly temperatures in degrees Fahrenheit at an airport. 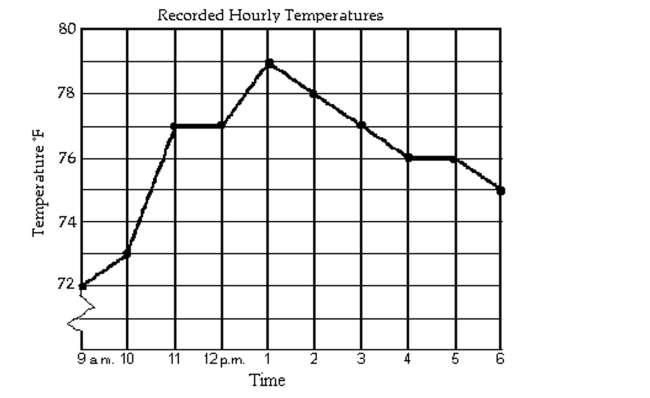
-During which two hour period did the temperature increase the most?
A) 10 a.m. to 11 a.m.
B) 9 a.m. to 11 a.m.
C) 10 a.m. to 12 p.m.
D) 12 p.m. to 2 p.m.
Correct Answer:

Verified
Correct Answer:
Verified
Related Questions
Q149: In Country X, the average hourly
Q150: For the given functions f and
Q151: Give the domain and range of
Q152: Describe how the graph of the
Q153: Graph the linear function and give
Q155: Determine whether the three points are
Q156: Find the center-radius form of the
Q157: Give the domain and range of
Q158: Describe how the graph of the
Q159: Determine the largest open intervals of