Multiple Choice
Find the average rate of change illustrated in the graph.
-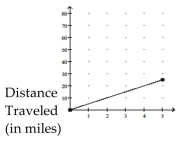
Time (in hours)
A) 25 miles per hour
B) 0.2 miles per hour
C) 5 miles per hour
D) 2.5 miles per hour
Correct Answer:

Verified
Correct Answer:
Verified
Related Questions
Q185: Use a graphing calculator to solve
Q186: Write an equation for the line
Q187: Determine whether the three points are
Q188: The graph of y = f(x)
Q189: Decide whether the relation defines a
Q191: Find the specified domain.<br>-Find the domain
Q192: Find the average rate of change illustrated
Q193: Give a rule for the piecewise-defined
Q194: Suppose the point (2, 4) is
Q195: Describe how the graph of the