Multiple Choice
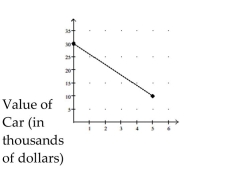
Find the average rate of change illustrated in the graph.
- Year
Year
A) -$5000.00 per year
B) $4000.00 per year
C) -$4000.00 per year
D) $5000.00 per year
Correct Answer:

Verified
Correct Answer:
Verified
Related Questions
Q45: Find the average rate of change
Q46: Graph the line and give the
Q47: Graph the equation by determining the
Q48: For the points P and Q,
Q49: Graph the line and give the
Q51: Provide an appropriate response.<br>-If the point
Q52: Determine whether the three points are
Q53: Graph the point symmetric to the given
Q54: Find the average rate of change
Q55: Write an equation for the line