Multiple Choice
Find the average rate of change illustrated in the graph.
-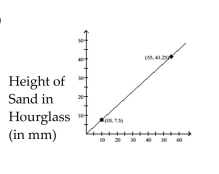 Time (in seconds)
A) 0.75 mm per second
B) 1.3 mm per second
C) 1 mm per second
D) 0.85 mm per second
Correct Answer:

Verified
Correct Answer:
Verified
Related Questions
Q77: Decide whether the relation defines a
Q78: Describe how the graph of the
Q79: Graph the point symmetric to the given
Q80: Use a graphing calculator to solve
Q81: Graph the equation by determining the
Q83: Decide whether the relation defines a
Q84: Describe how the graph of the
Q85: Use the graphs to find the
Q86: Determine whether the equation has a
Q87: Write an equation for the line