Multiple Choice
Find the average rate of change illustrated in the graph.
-A school has just purchased new computer equipment for $23,000.00. The graph shows the depreciation of the equipment over 5 years. The point (0, 23,000) represents the purchase price and the point (5, 0) represents when
The equipment will be replaced. Find and interpret the average rate of change in cost per year. 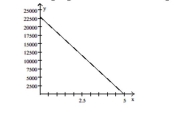
A) per year; the value of the equipment decreases by per year during these years.
B) - per year; the value of the equipment decreases by per year during these years.
C) per year; the value of the equipment increases by per year during these years.
D) per year; the value of the equipment decreases by per year during these years.
Correct Answer:

Verified
Correct Answer:
Verified
Q19: Graph the equation by determining the
Q20: Give the domain and range of
Q21: A video rental company charges $5
Q22: Determine if the function is even,
Q23: Match the equation with the correct
Q25: The figure below shows the graph
Q26: Sketch a graph showing the distance (in
Q27: Decide whether the relation defines a
Q28: Graph the equation by plotting points.<br>-
Q29: Write all linear equations in slope-intercept