Multiple Choice
A new chocolate company is estimating how many candy bars per week college students will consume of their line of
products. The graph shows the probable number of candy bars students (age 18-22) will consume from year 0 to year 10.
B(x) gives the number of candy bars for boys, G(x) gives the number of candy bars for girls, and T(x) gives the total
number for both groups. Use the graph to answer the question. 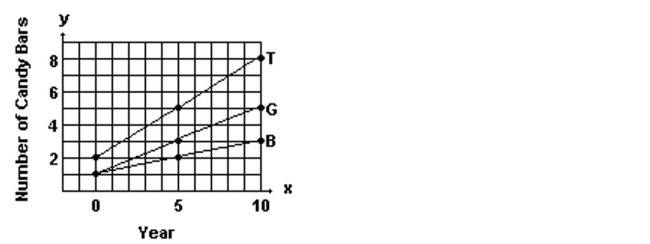
-Estimate B(4) and G(4) and use your estimates to estimate T(4) .
A) 1.5; 2.5; 4.0
B) 1.8; 2.5; 4.3
C) 2.0; 2.8; 4.8
D) 2.0; 3.0; 5.0
Correct Answer:

Verified
Correct Answer:
Verified
Q36: Find the center and radius of
Q37: Find the slope and the y-intercept
Q38: Assume it costs 25 cents to
Q39: Find all values of <span
Q40: Describe the transformations and give the
Q42: The graph of a linear function
Q43: Provide an appropriate response.<br>-Are the points A(3,
Q44: Describe how the graph of the
Q45: Find the average rate of change
Q46: Graph the line and give the