Multiple Choice
Solve the problem.
-The town of Appleville recorded the following dates and populations. 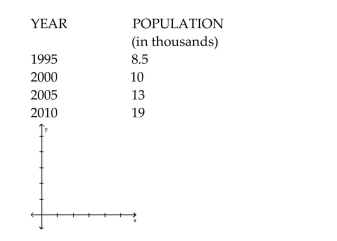 Draw a graph of the population as a function of time. What was the approximate population of Appleville in 2002?
A) 11,000
B) 12,000
C) 13,000
D) 10,000
Correct Answer:

Verified
Correct Answer:
Verified
Related Questions
Q104: Write an equation relating the variables
Q105: Solve the equation.<br>-2x + 7 = 2(x
Q106: Solve the problem.<br>-Find the 15th term
Q107: Solve the problem.<br>-On August 13, the Bryer
Q108: If R is the set of
Q110: Find or investigate the function as
Q111: Solve the problem.<br>-The sum of three consecutive
Q112: Solve the problem.<br>-A high school graduating class
Q113: Solve the problem.<br>-Find the nth term
Q114: Write an expression in terms of the