Multiple Choice
Here is a stacked bar chart for data collected about employee blood pressure. 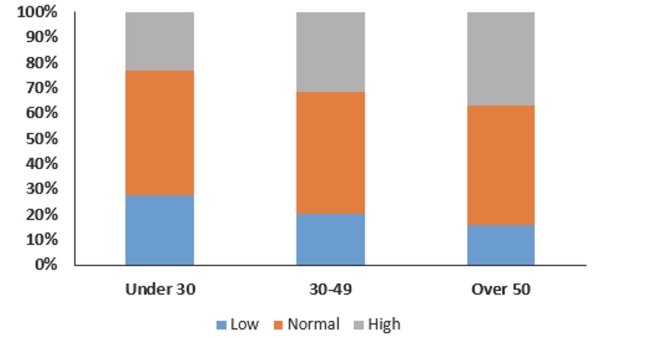 This chart shows
A) the distribution of a quantitative variable.
B) the contingency distribution of blood pressure type.
C) the conditional distribution of blood pressure type.
D) the marginal distribution of blood pressure type.
E) the joint distribution of blood pressure type.
Correct Answer:

Verified
Correct Answer:
Verified
Q19: The following is a bar chart summarizing
Q20: To determine if people's preference in dogs
Q21: A large national retailer of electronics
Q22: A regional survey was carried out
Q23: A company interested in the health
Q24: A company interested in the health
Q25: Has the percentage of young girls drinking
Q27: Has the percentage of young girls drinking
Q28: A company interested in the health
Q29: To determine if people's preference in dogs