Multiple Choice
The side-by-side boxplots show the cumulative college GPAs for sophomores, juniors, and
Seniors taking an intro stats course in Autumn 2003.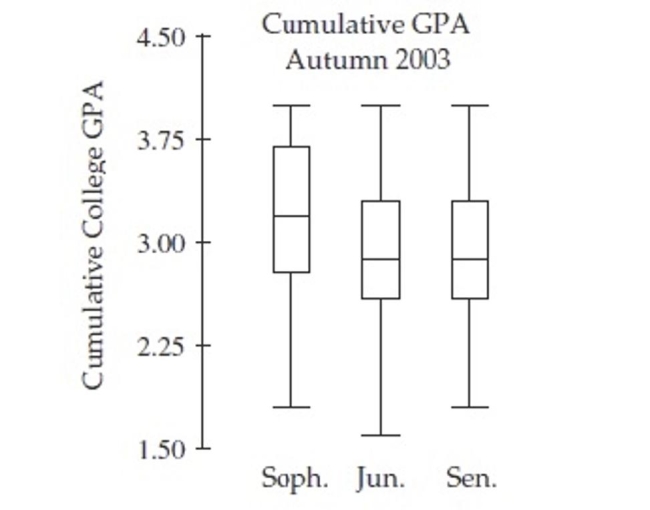
Which class has the most skewed set of GPAs?
A) Sophomore
B) Junior
C) Senior
D) Both Junior and Senior
Correct Answer:

Verified
Correct Answer:
Verified
Q18: The side-by-side boxplots show the cumulative college
Q19: At www.census.gov you can create a "population
Q20: The side-by-side boxplots show the cumulative college
Q21: A few of the male students are
Q22: The following boxplots show monthly sales revenue
Q23: The boxplots show the age of people
Q25: The side-by-side boxplots show the cumulative college
Q26: The side-by-side boxplots show the cumulative college
Q27: The five-number summary for the weights
Q28: The boxplots show prices of used cars