Multiple Choice
Use this graph to answer the question.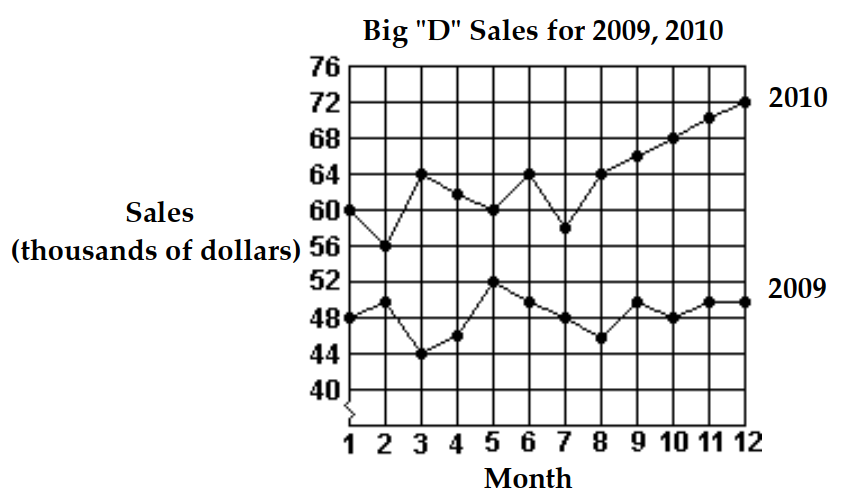
-What month in 2010 had the lowest sales?
A) Month 12
B) Month 3
C) Month 2
D) Month 5
Correct Answer:

Verified
Correct Answer:
Verified
Related Questions
Q32: Give the quadrant in which the point
Q33: Find the average rate of change.
Q34: Decide whether the pair of lines is
Q35: Use this graph to answer the question.<br><img
Q36: Decide whether the pair of lines is
Q38: Give the quadrant in which the point
Q39: Decide whether the pair of lines is
Q40: <span class="ql-formula" data-value="\text { Locate the point
Q41: Write the equation of a circle
Q42: Graph the following line.<br>-Through <span