Multiple Choice
Use this graph to answer the question.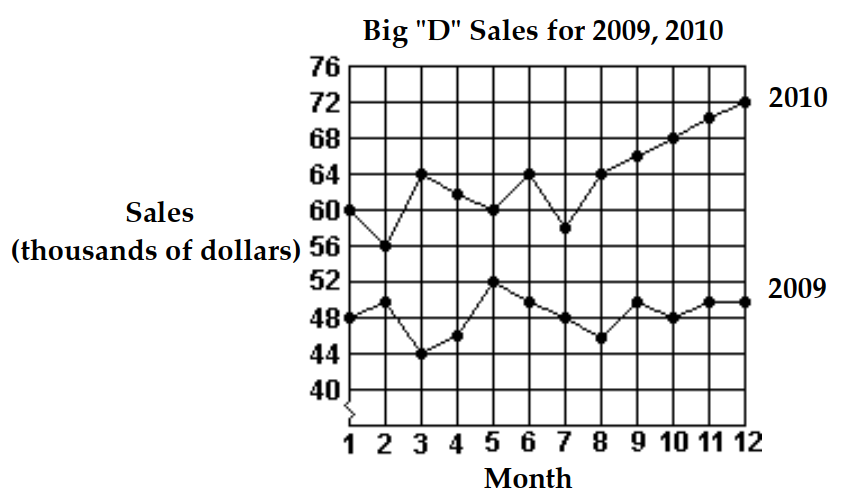
-What month in 2009 had the highest sales?
A) Month 2
B) Month 3
C) Month 5
D) Month 12
Correct Answer:

Verified
Correct Answer:
Verified
Related Questions
Q108: Use the distance formula to find
Q109: Graph the circle.<br>- <span class="ql-formula" data-value="x^{2}+(y-1)^{2}=9"><span
Q110: Graph the following line.<br>- <span class="ql-formula"
Q111: Graph the circle.<br>- <span class="ql-formula" data-value="(
Q112: Solve the problem.<br>-The enrollment at State University
Q114: Find the center and radius of
Q115: Find the midpoint of the line
Q116: Find the center and radius of
Q117: Decide whether the pair of lines is
Q118: Choose one of the four lines