Multiple Choice
Use this graph to answer the question.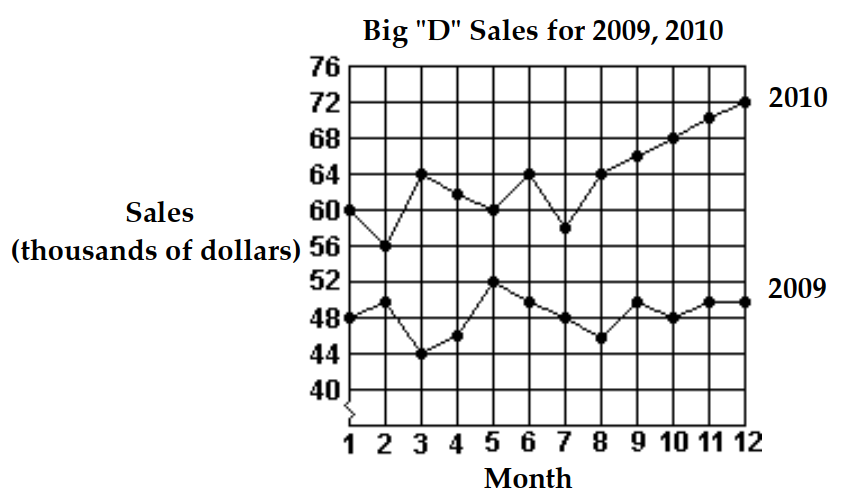
-What was the total increase in sales from 2009 to 2010?
A) $182,000
B) $22,000
C) $12,000
D) $1,342,000
Correct Answer:

Verified
Correct Answer:
Verified
Related Questions
Q66: Determine the quadrants in which the
Q67: Write the equation of a circle
Q68: Decide whether the pair of lines is
Q69: Find the center and radius of
Q70: Find the y- and x-intercepts for
Q72: Find the y- and x-intercepts for
Q73: Use the distance formula to find
Q74: <span class="ql-formula" data-value="\text { Locate the point
Q75: Write the equation of a circle with
Q76: Graph the following line.<br>-Through <span