Multiple Choice
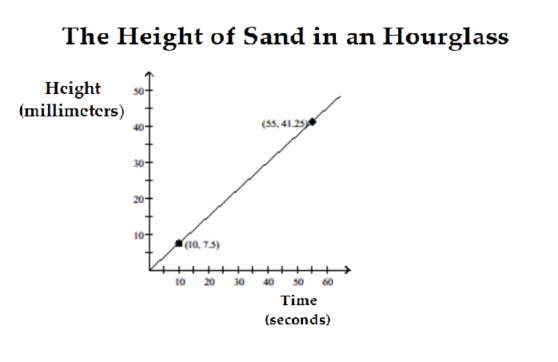
The graph below shows the height of sand in an hourglass at various times. Use the graph to find the average rate of change of the height of the sand.
A) per second
B) per second
C) per second
D) per second
Correct Answer:

Verified
Correct Answer:
Verified
Related Questions
Q117: Decide whether the pair of lines is
Q118: Choose one of the four lines
Q119: Find the average rate of change.
Q120: Decide whether the statement is true or
Q121: Find the y- and x-intercepts for
Q123: Find the midpoint of the line
Q124: Solve the problem.<br>-A motorcycle daredevil is
Q125: <span class="ql-formula" data-value="\text { Locate the point
Q126: Find the slope of the line
Q127: Find the center and radius of