Multiple Choice
Solve the problem.
-The number of births in County A has been increasing in recent years. Use the information given in the bar graph for the years 1960 and 1990, letting x = 0 represent the year 1960 and letting y represent the number of births. Use the graph to estimate the number of births in 1965. 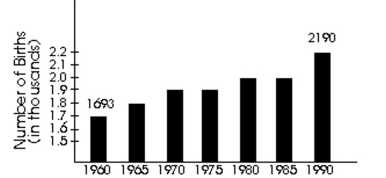
A) 1800
B) 1750
C) 1900
D) 1850
Correct Answer:

Verified
Correct Answer:
Verified
Q218: It is necessary to have a 40%
Q219: Solve the problem.<br>-Company A rents copiers for
Q220: Solve the inequality, then graph the
Q221: Solve the formula for the specified
Q222: Solve the equation.<br>- <span class="ql-formula" data-value="\frac
Q224: Match the inequality with its correct
Q225: Evaluate.<br>- <span class="ql-formula" data-value="4 ^ {
Q226: Find the average rate for an athlete
Q227: A biologist collected 201 fern and moss
Q228: In order for a chemical reaction