Multiple Choice
Use the graph of population change per year for a metro area to answer the question. 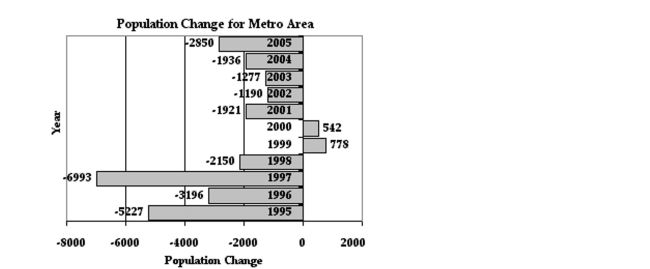
-In which two years did the population of the metro area increase?
A) 1998 and 1999
B) 1999 and 2000
C) 2000 and 2001
D) 1997 and 2001
Correct Answer:

Verified
Correct Answer:
Verified
Q78: Express the rational number as a
Q79: True or False? <br> <span class="ql-formula"
Q80: Perform the operation and give the
Q81: Identify the property illustrated by the statement.<br>-9
Q82: Solve the problem.<br>-Anne writes one page
Q84: Solve the problem.<br>-A coupon advertises ice
Q85: Perform the indicated operation.<br>-(-5)(10)(-5)(-3)<br>A)-750<br>B)-755<br>C)750<br>D)755
Q86: Perform the indicated operations.<br>- <span class="ql-formula"
Q87: Round the number to the nearest thousandth,
Q88: Decide whether the rational number yields