Multiple Choice
Use the graph of population change per year for a metro area to answer the question. 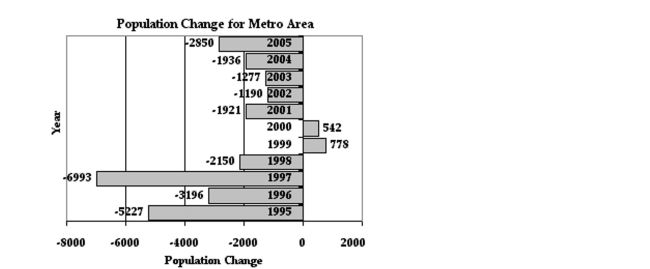
-In which year did the population of the metro area decrease the most?
A) 2005
B) 1995
C) 2000
D) 1997
Correct Answer:

Verified
Correct Answer:
Verified
Related Questions
Q176: Find the square root correct to
Q177: Solve the problem.<br>-The temperature at the South
Q178: Use the information in the table to
Q179: Write a fraction in lowest terms
Q180: Solve the problem.<br>-A coupon advertises ice
Q182: Select the smaller of the two
Q183: 908 is what percent of 1645?<br>A)0.06%<br>B)181.17%<br>C)0.55%<br>D)55.20%
Q184: Solve the problem.<br>-Find the total cost of
Q185: Perform the operation and give the
Q186: Write a fraction in lowest terms