Multiple Choice
Use this graph to answer the question. 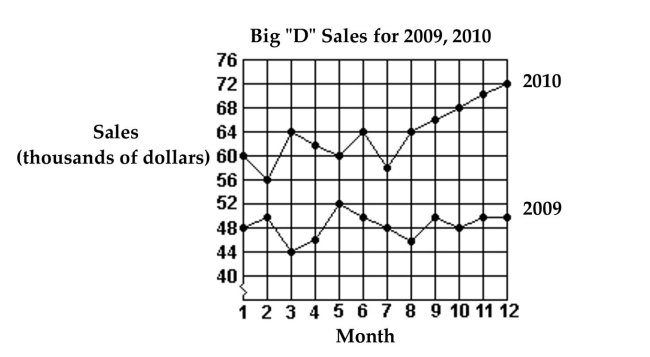
-What were the total sales for 2009?
A) $48,000
B) $582,000
C) $764,000
D) $50,000
Correct Answer:

Verified
Correct Answer:
Verified
Related Questions
Q131: Make a bar graph to represent
Q132: Solve the problem.<br>-To get a C in
Q133: Use this graph to answer the question.
Q134: Find the median for the given
Q135: useful for comparing the size of each
Q137: Construct a frequency polygon.<br>- <span class="ql-formula"
Q138: Answer the question.<br>-The bar graph below shows
Q139: Find the median.<br>- <span class="ql-formula" data-value="\begin{array}
Q140: useful for comparing the size of each
Q141: Construct a stem and leaf display for