Multiple Choice
Use this graph to answer the question. 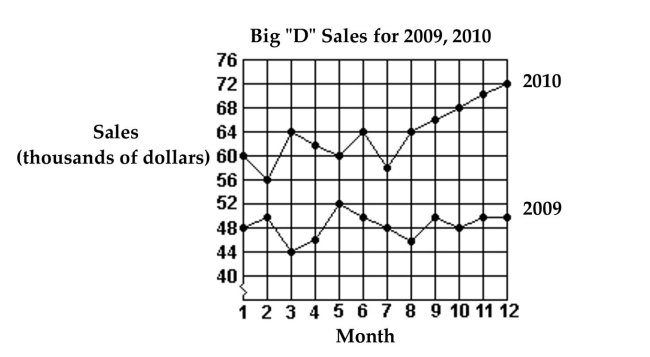
-What was the total increase in sales from 2009 to 2010?
A) $182,000
B) $12,000
C) $1,342,000
D) $22,000
Correct Answer:

Verified
Correct Answer:
Verified
Related Questions
Q75: In a school survey, students showed these
Q76: useful for comparing the size of each
Q77: Answer the question.<br>-The bar graph below shows
Q78: In a school survey, students showed these
Q79: useful for comparing the size of each
Q81: Find the mean for the given sample
Q82: On a math test, the scores
Q83: Construct a frequency polygon.<br>- <span class="ql-formula"
Q84: Find the median for the given
Q85: Use this graph to answer the question.