Multiple Choice
This double-bar graph shows the number of male (M) and female (F) athletes at a university over a four-year period.
Answer the question. 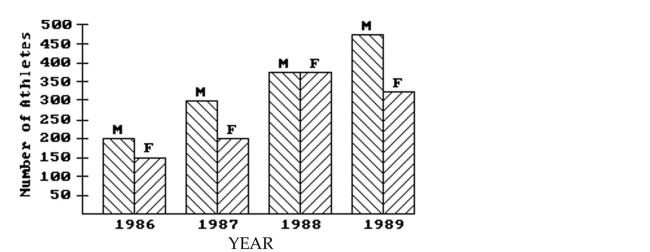
-What percentage of all students involved in athletics in 1986 was female? (Round to the nearest percent.)
A) 57%
B) 43%
C) 75%
D) 14%
Correct Answer:

Verified
Correct Answer:
Verified
Related Questions
Q2: Find the mode or modes.<br>-The weights
Q3: Use the graph to answer the question.<br>-<img
Q4: Solve the problem.<br>-Jackie's sisters weigh 116 lb,
Q5: Construct a vertical bar graph for
Q6: Solve the problem.<br>-Sheryl's mean score on eight
Q8: Find the mode or modes.<br>-61, 25, 61,
Q9: Find the median.<br>-17, 22, 35, 47, 63,
Q10: Construct a stem and leaf display
Q11: The table lists the winners of
Q12: In a school survey, students showed these