Multiple Choice
Use the graph to answer the question.
-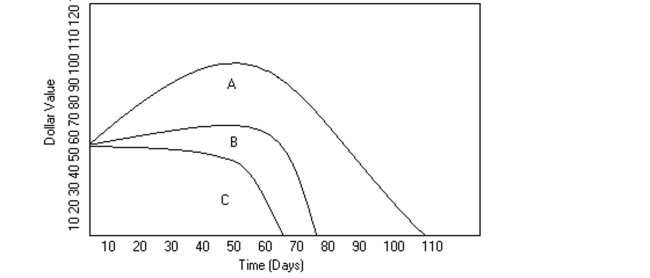 Mike decides to buy shares of companies A, B, and C, which were initially selling for the same price. The changes in each stock's value are shown in the graph above. Knowing what he knows
Now, after how many days should he have sold in his stock in company A?
A) 30
B) 50
C) 60
D) 80
Correct Answer:

Verified
Correct Answer:
Verified
Q9: Find the median.<br>-17, 22, 35, 47, 63,
Q10: Construct a stem and leaf display
Q11: The table lists the winners of
Q12: In a school survey, students showed these
Q13: Find the mean for the given
Q15: Find the median.<br>-6, 12, 25, 28, 42,
Q16: Construct a frequency polygon.<br>- <span class="ql-formula"
Q17: Construct the specified histogram.<br>-The frequency table
Q18: Find the mean for the given
Q19: Provide an appropriate response.<br>-The median of a