Multiple Choice
Use the graph to answer the question.
-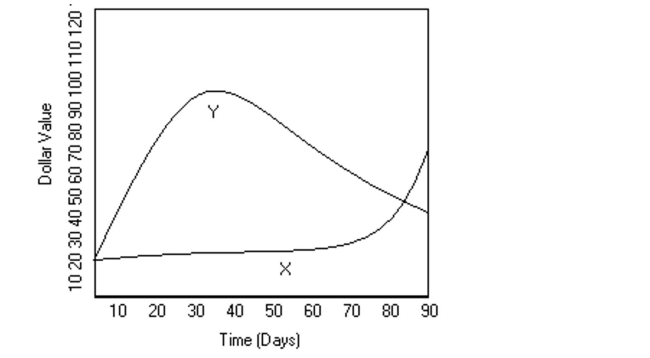 Mike decides to buy shares of companies X and Y, which were initially selling for the same price. The changes in each stock's value over 90 days are shown in the graph above. Using the trend of
The graph at 90 days, do you expect the value of Stock X to increase or decrease over the upcoming
Days?
A) Decrease
B) Increase
Correct Answer:

Verified
Correct Answer:
Verified
Q45: Answer the question.<br>-The bar graph below shows
Q47: Find the mean for the given
Q48: Find the median for the given
Q49: Find the mode or modes.<br>-Last year,
Q51: Construct a frequency polygon.<br>- <span class="ql-formula"
Q52: Use this graph to answer the question.
Q53: Find the mean for the given sample
Q54: Explain how two data sets could have
Q54: Construct the specified histogram.<br>-The ages of
Q55: Find the median.<br>-41, 14, 7, 7, 28,