Multiple Choice
Use the graph to answer the question.
-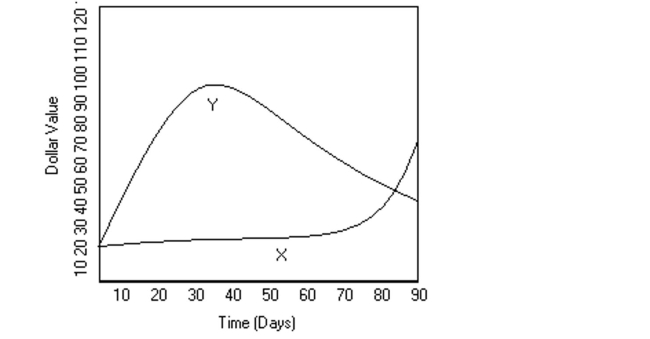 Mike decides to buy shares of companies X and Y, which were initially selling for the same price. The changes in each stock's value over 90 days are shown in the graph above. At its peak, about
How much more was stock Y worth than X?
A) $65
B) $90
C) $45
D) $75
Correct Answer:

Verified
Correct Answer:
Verified
Q142: Solve the problem.<br>-Samuel consumed 2129 calories of
Q143: In a school survey, students showed these
Q144: Construct a frequency polygon.<br>- <span class="ql-formula"
Q145: useful for comparing the size of each
Q146: Find the indicated probability.<br>-The table shows the
Q148: Find the median for the given
Q149: Find the median for the given
Q150: In a school survey, students showed these
Q151: Suppose that you want to construct
Q152: Find the indicated probability.<br>-In a survey,