Multiple Choice
Use this graph to answer the question. 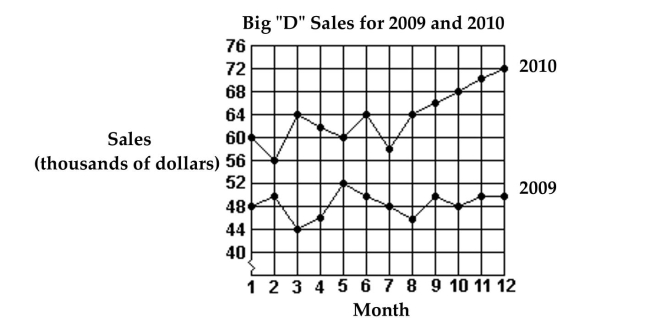
-Which month in 2009 had the lowest sales?
A) Month 6
B) Month 3
C) Month 2
D) Month 8
Correct Answer:

Verified
Correct Answer:
Verified
Related Questions
Q39: Use problem solving strategies to solve the
Q40: Solve the problem using inductive reasoning.<br>-Write the
Q41: Use the method of successive differences to
Q42: Find a pattern and use it to
Q43: Determine what the next equation would be,
Q45: How many triangles are in the next
Q46: Complete the magic (addition)square. A magic
Q47: Solve the problem.<br>-Rose's work ID is
Q48: Use inductive reasoning to predict the next
Q49: Use problem solving strategies to solve the