Multiple Choice
Use this graph to answer the question. 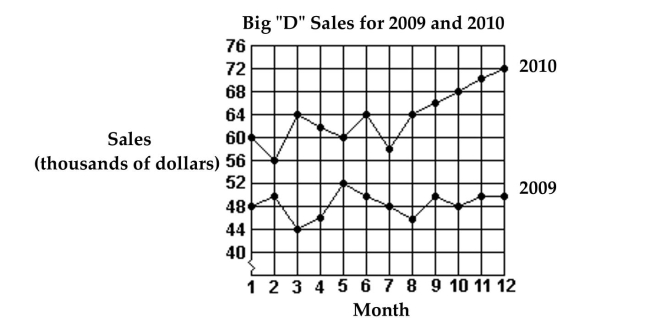
-What were the total sales for 2009?
A) $50,000
B) $582,000
C) $48,000
D) $764,000
Correct Answer:

Verified
Correct Answer:
Verified
Related Questions
Q129: Solve the problem.<br>-six painters can paint
Q130: Decide whether the argument is an example
Q131: Use your calculator to perform the indicated
Q132: Give the appropriate counting number answer to
Q133: Determine if the sequence is an arithmetic
Q135: Use your calculator to perform each
Q136: Determine the most probable next term
Q137: If the hometown baseball team scored 3
Q138: In a school survey, students showed these
Q139: The bar graph below shows the number