Multiple Choice
Use this graph to answer the question. 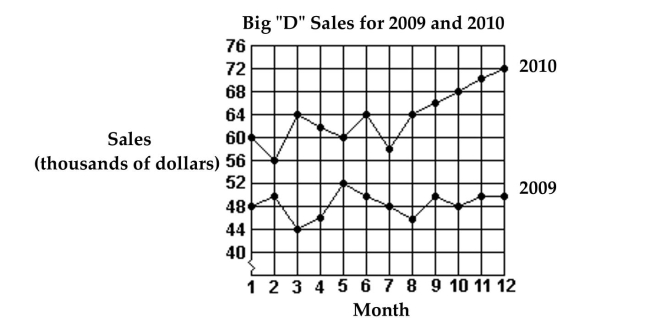
-What was the total increase in sales from 2009 to 2010?
A) $22,000
B) $12,000
C) $182,000
D) $1,342,000
Correct Answer:

Verified
Correct Answer:
Verified
Related Questions
Q68: Use the method of successive differences to
Q69: Use inductive reasoning to predict the next
Q70: Use your calculator to perform each
Q71: Determine the indicated term in the given
Q72: Use the indicated formula to find
Q74: Find a pattern and use it to
Q75: Determine the most probable next term in
Q76: Determine what the next equation would be,
Q77: Determine if the sequence is an arithmetic
Q78: Determine the indicated term in the