Multiple Choice
Solve the problem.
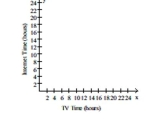
-The table below shows the times (in hours) that seven students spend watching television and using the internet. Construct a scatter diagram for the data and state whether these times have no correlation, a positive correlation, or a negative correlation.
A) Negative correlation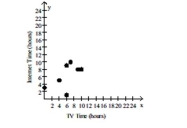
B) Positive correlation
C) No correlation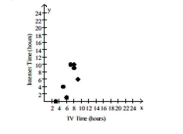
D) Positive correlation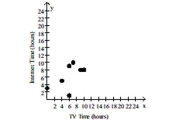
Correct Answer:

Verified
Correct Answer:
Verified
Q2: Select the best-fit line for the
Q3: To get the best deal on
Q4: Solve the problem.<br>-The following table gives
Q5: State whether there is no correlation, a
Q6: Select the best estimate of the correlation
Q8: State whether you believe the two variables
Q9: Select the best-fit line for the
Q10: Select the best estimate of the correlation
Q11: The table contains the weights (in
Q12: Solve the problem.<br>-The table below shows